What History Teaches Us about Elections, Policy and Investing
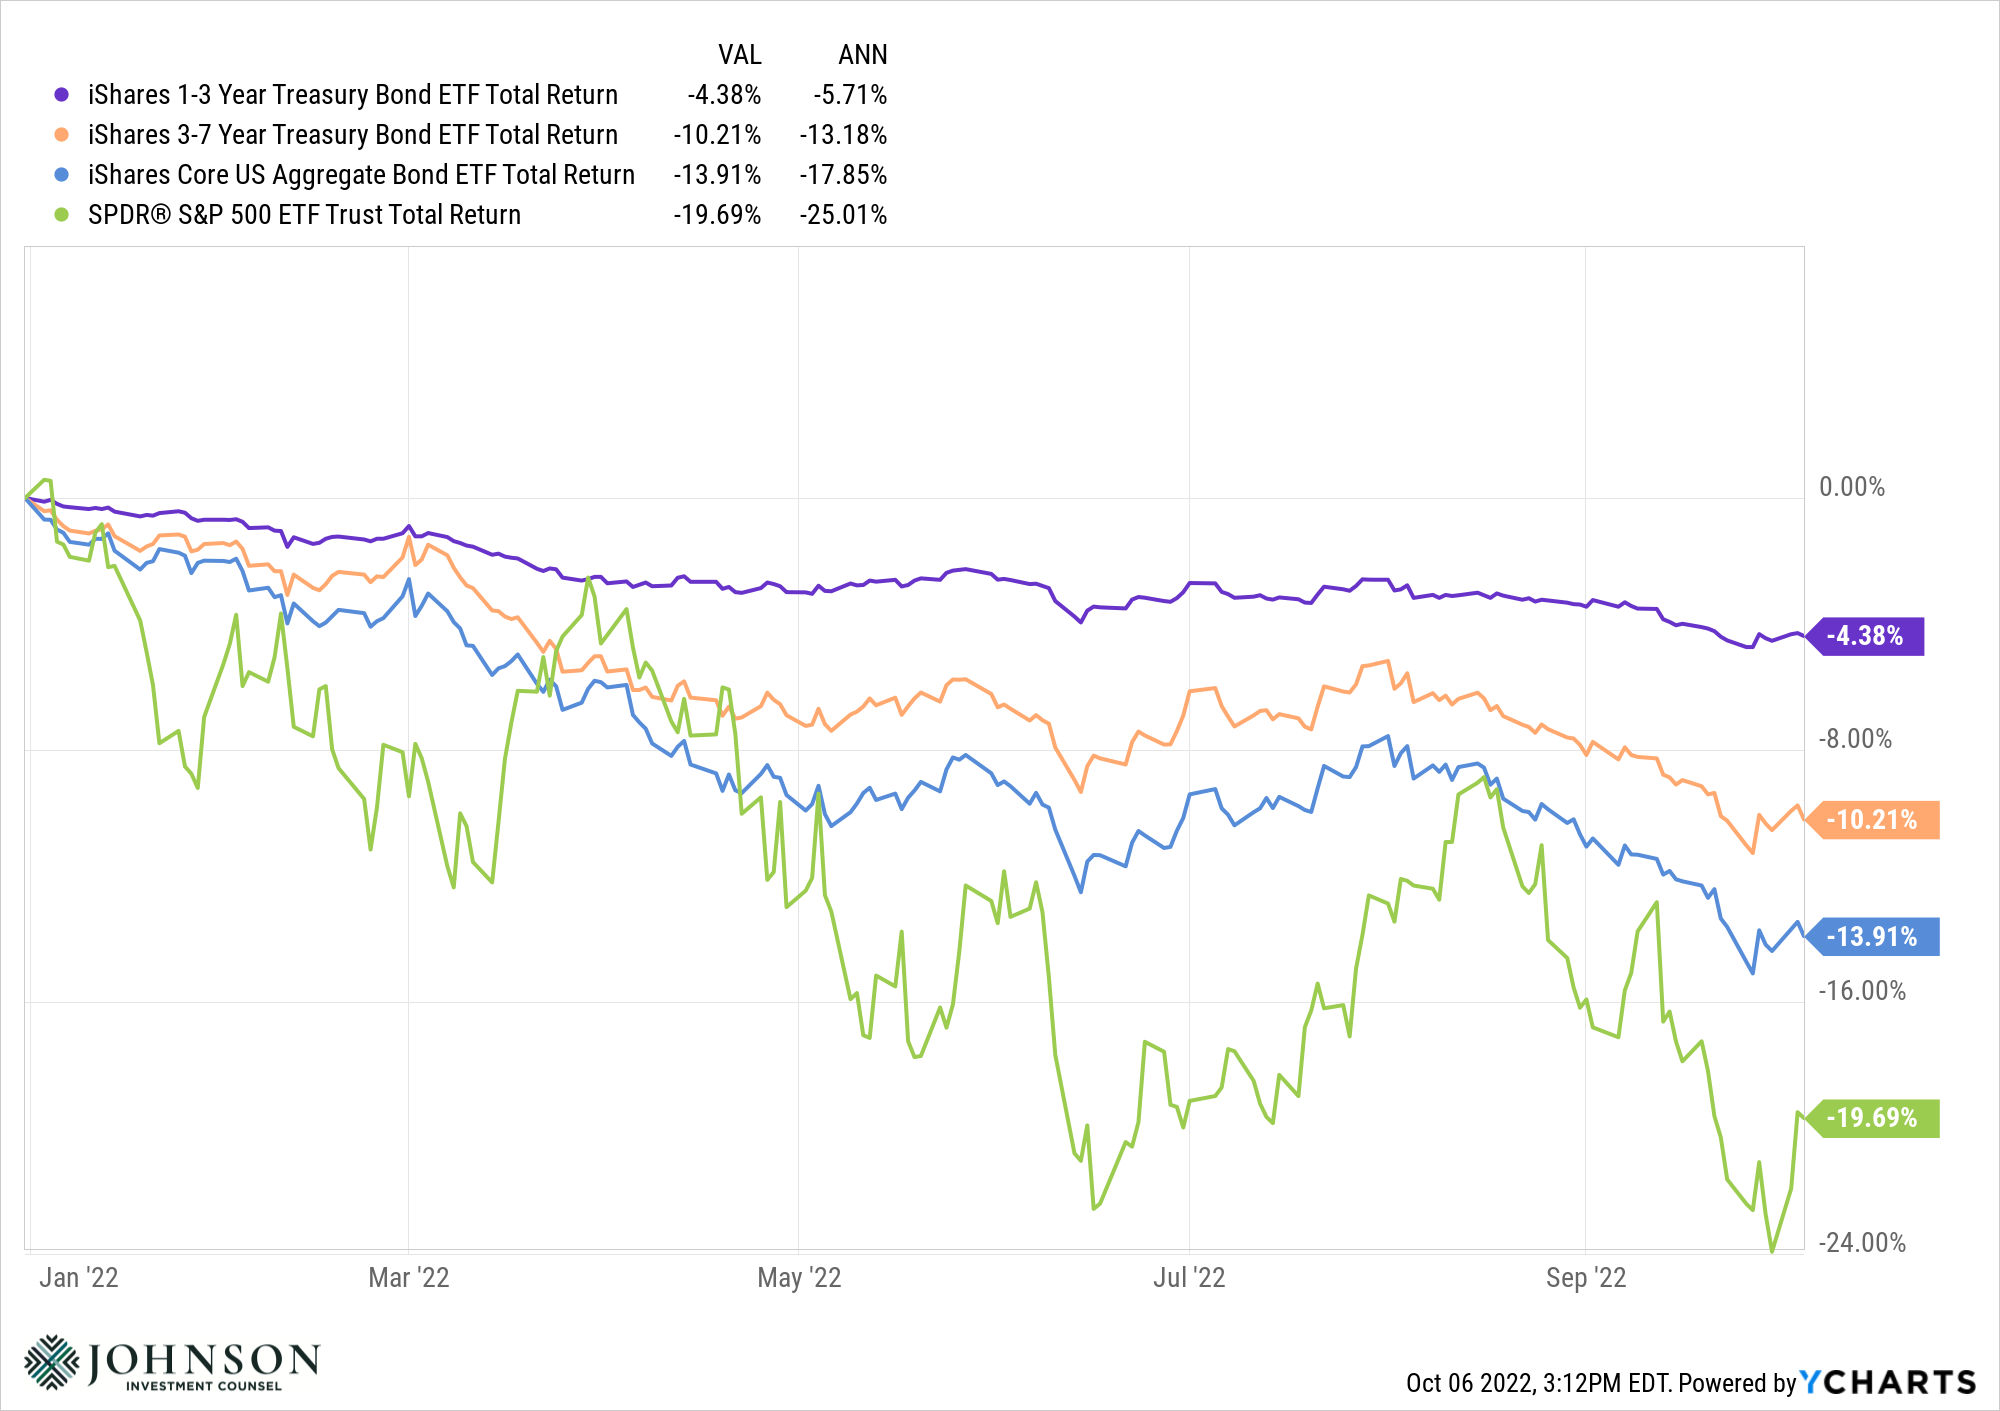
If there were any doubt about how government policy can influence returns in stocks, bonds, and other assets, the last three years can serve as Exhibit A that policy can matter – a lot. From the government-mandated Covid lockdowns in 2020 to the subsequent interest rate cuts to massive Covid relief government spending, we are now seeing the harsh whipsaw effects of swings in monetary and fiscal policy on our monthly investment statements. Hindsight is most certainly 20/20 as it's clear the stimulative effects of the government response to the Covid pandemic (along with other factors) have resulted in an unwelcome hangover of pervasive inflation and stagnating economic growth. Unfortunately, the prescribed elixir for this malady is the blunt force tool of rapid and intense interest rate escalations employed by the Federal Reserve in the form of increasing the Fed Funds rate. This dynamic (along with many other global factors) has resulted in the double-whammy effect of declining stock prices along with higher bond yields (and therefore lower bond prices) as shown below. One could argue cash is a safe haven, but even cash is robbed of purchasing power with elevated inflation.

As macroeconomic and geopolitical events play out, political leaders are usually compelled to respond with policies to help soften the blow from exogenous events (pandemics, wars, etc.) or economic cross currents (inflation, slowing growth). These responses come in the form of new laws, policies, and regulations factoring in all available information. These decisions are made by individuals, either elected or appointed as part of our democratic republic system of government. As such, we should be aware of the impact of who is in office making these decisions and of course, be vigilant and vote in these very important elections. And right on cue (as if we needed more news items in the cycle), the 2022 mid-term elections are upon us in yet another critically important juncture that could dictate how future policies are enacted.
While political opinions run a wide spectrum in our great country, it’s helpful to be cognizant of two historical trends. The first is how congressional leadership has changed during prior mid-term election cycles and the second is what it has meant for market returns in the past. 2022 is a year unlike any other and there are many other factors in play. We are not predicting what is going to happen nor are we implying a forecast for future returns based on the outcome of this November’s election.
What the Numbers Show
Broadly speaking, mid-term elections tend to favor the party opposing the sitting president. Typically, this is viewed as the electorate’s implicit response to a president’s aggressive policy implementation and a de facto “check” on the power of the Oval Office. According to Ned Davis Research, since 1902 the median number of House seats lost by a Republican president has been 27 while the median number of seats lost by Democratic presidents is 36. Today, the House of Representatives (435 total members) is comprised of 212 Republicans and 221 Democrats (and two vacancies). If history is any guide, even ½ of the historical median “flip” of 36 seats would place Republicans back in the majority in the House.
In the Senate, the historical median number of seats lost by a Democratic president is five while for a Republican president it’s one. Currently, there are 50 Republicans, 48 Democrats, and 2 Independents (that almost exclusively vote Democrat) with the tie-breaker going to the Democratic Vice President. If the historical median applies to the Senate, Republicans could hold the majority here as well after election night 2022.
If that were to happen, what does it mean for markets? Is it a good thing or a bad thing and why?
History teaches us that a healthy “mix” of opposing parties has yielded the best performance for the Dow Jones Industrial Average, also according to Ned Davis Research. A Democratic president with a Republican congress has occurred about 10% of all years with an average gain per year of 9.05%. This is second only to a Democratic President and a split congress (3.3% of the time), which has averaged a 10.4% gain per year. We must be careful attributing these returns the political environment alone, as there are many factors to consider. But there is certainly a historical precedent for strong markets with mixed government.
One possible explanation is that markets prefer the certainty that comes with a split government, gridlocked from being able to take political ambitions too far. Investors are likely more confident when the rules of the game are well known and unlikely to change on a policy whim or unchecked regulatory modifications.
Bottom Line: Investing and Politics Don’t Mix
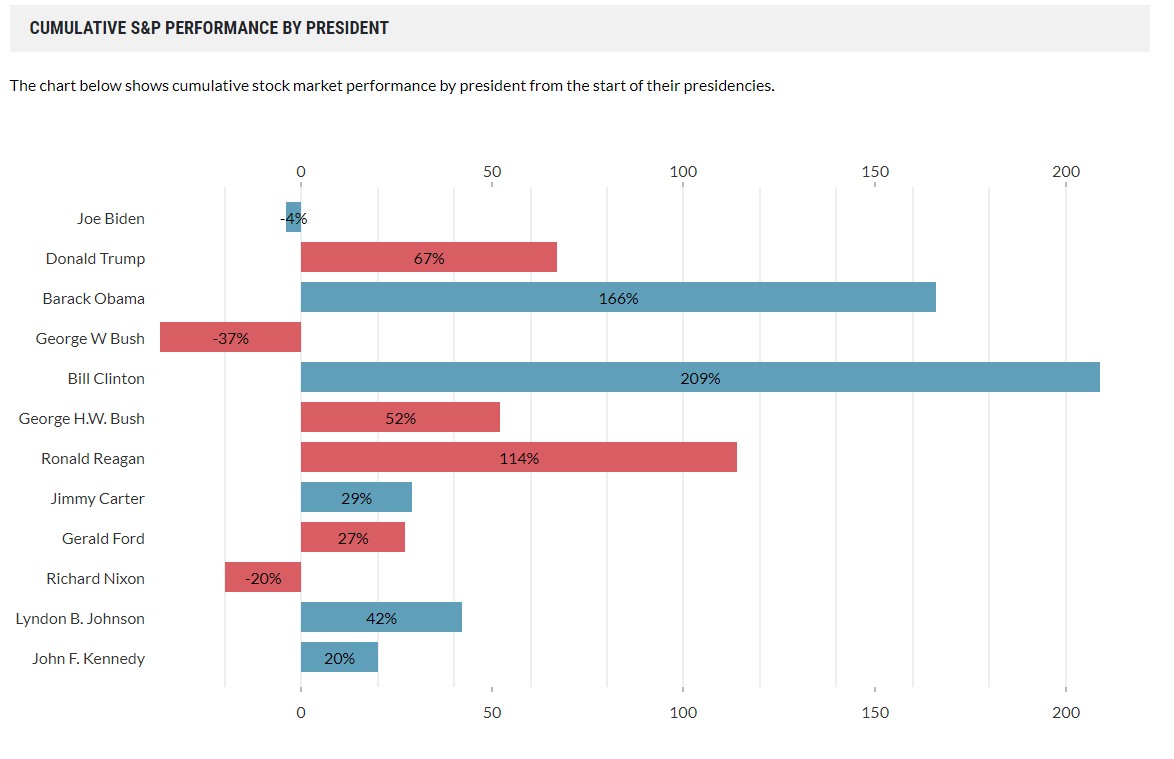
Despite the historic trends for a split government, we caution our clients from extrapolating what they hear on the stump to their investment strategy. Too often, political opinion clouds investment acumen. There is no more clarifying example of this than the market returns during various presidential terms (shown below). Whatever one’s political views, selling when your candidate loses and buying when your candidate wins has historically been detrimental to a long-term wealth plan. Markets have no allegiance to the Democrats nor the Republicans.

One person or one candidate certainly has influence on the investing environment, but policies and laws must be placed in the proper context with many other powerful factors including economic trends, geopolitical events. Fed policy, tax policy and valuations. We strongly encourage our clients to participate in the democratic process, know the issues and be active participants in choosing and supporting candidates. But we believe it’s our duty to counsel our clients against allowing too much election-driven optimism or pessimism to detract from broader wealth planning and investment goals.
Published 10/18/2022
Johnson Investment Counsel cannot promise future results. Any expectations presented here should not be taken as any guarantee or other assurance as to future results. Our opinions are a reflection of our best judgment at the time this material was created, and we disclaim any obligation to update or alter forward-looking statements as a result of new information, future events, or otherwise.
